Find out how network mapping can unleash insights in your data.
Combine experimental data with domain knowledge, statistical methods, multivariate analyses and machine learning to create information rich networks.
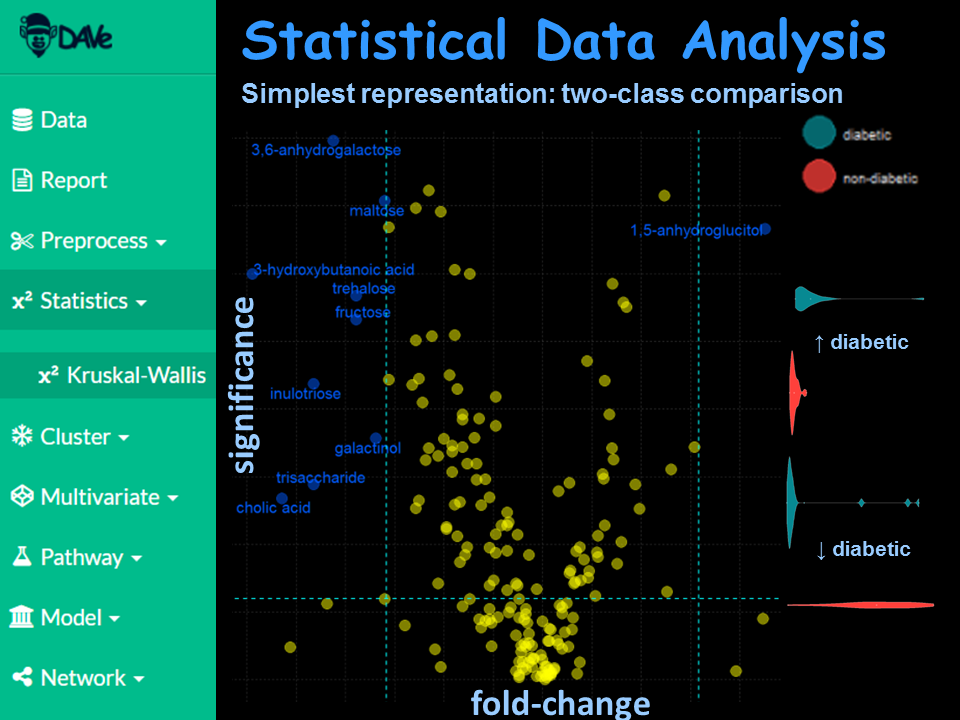
Carry out statistical analyses to identify significant relationships or altered variables between groups.
Use parametric and non-parametric methods to test a variety of hypotheses.
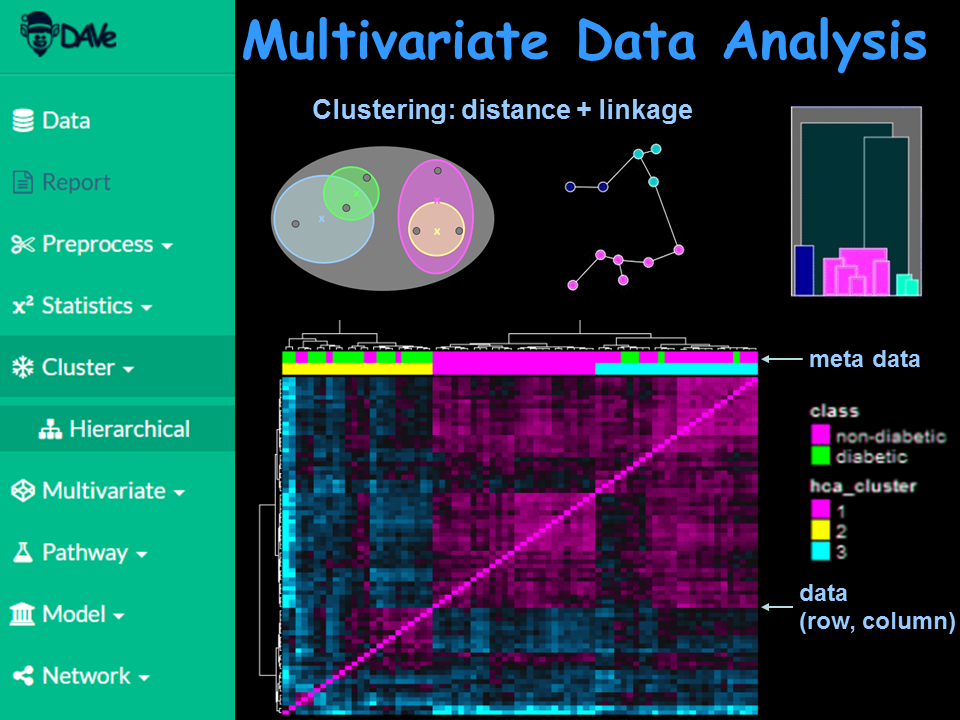
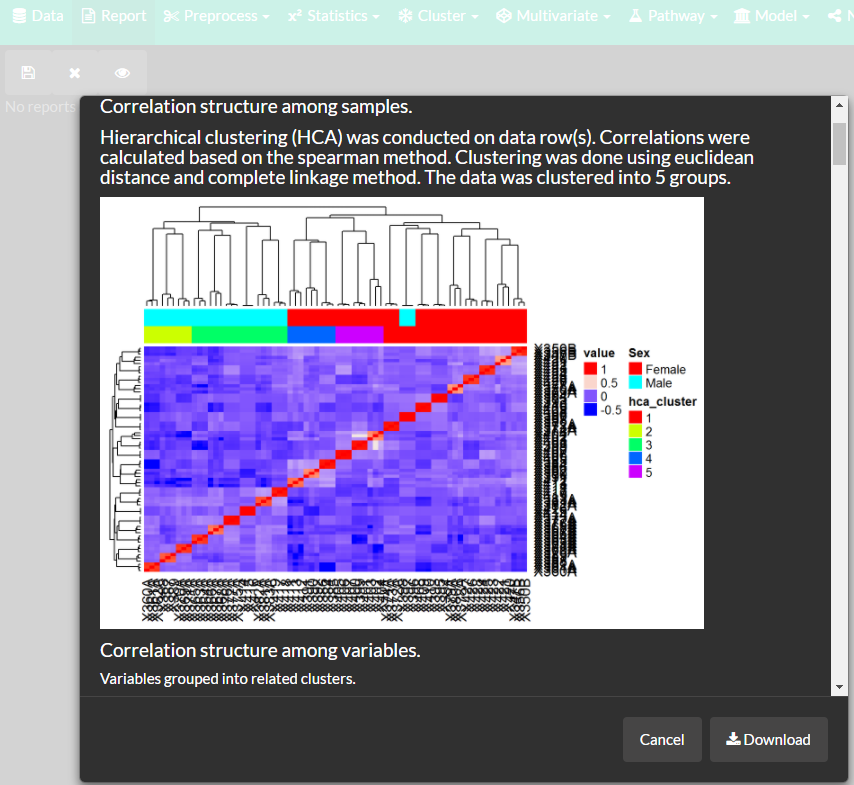
Identify similarities between groups using supervised and non-supervised clustering methods.
Carry out hierarchical, fuzzy, density and other clustering analyses using a variety of distance and linkage methods.
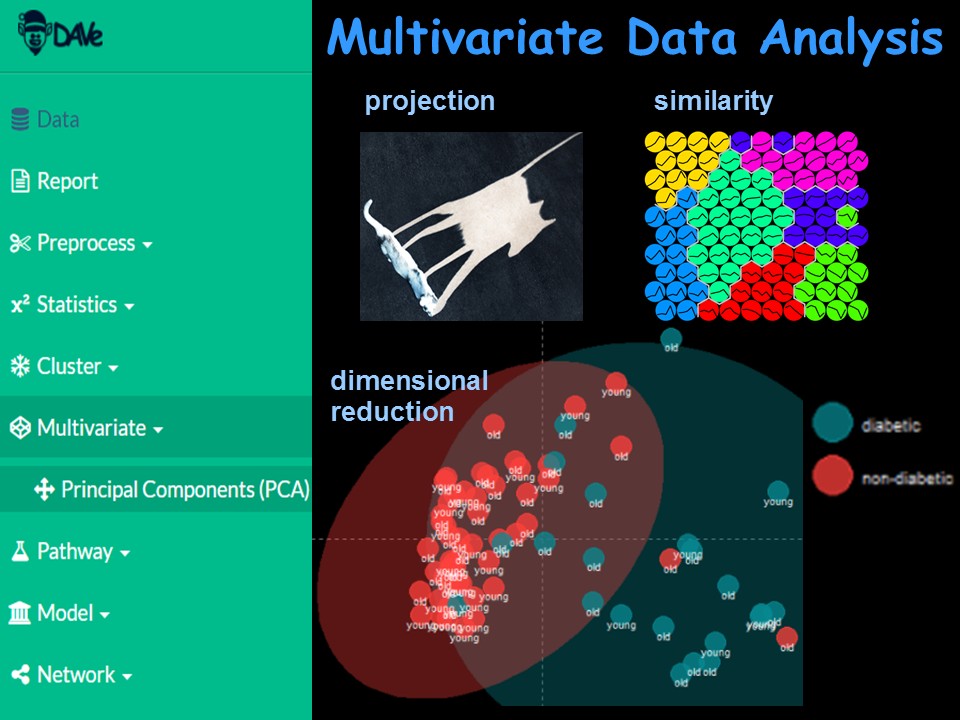
Use dimensional reduction and projection methods to analyze and visualize multivariate relationships and trends.
Apply algorithms including PCA, MDS, tSNE and other techniques to overview complex multivariate relationships.
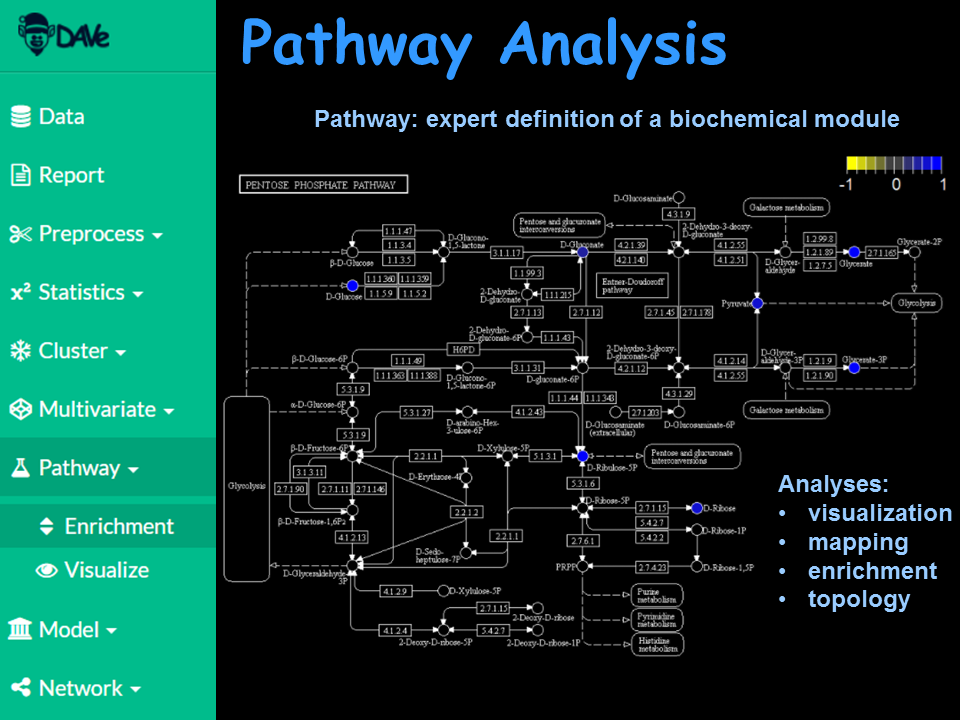
Add domain knowledge using biochemical pathway analysis.
Visualize changes in groups within a metabolic, proteomic and genomic context.
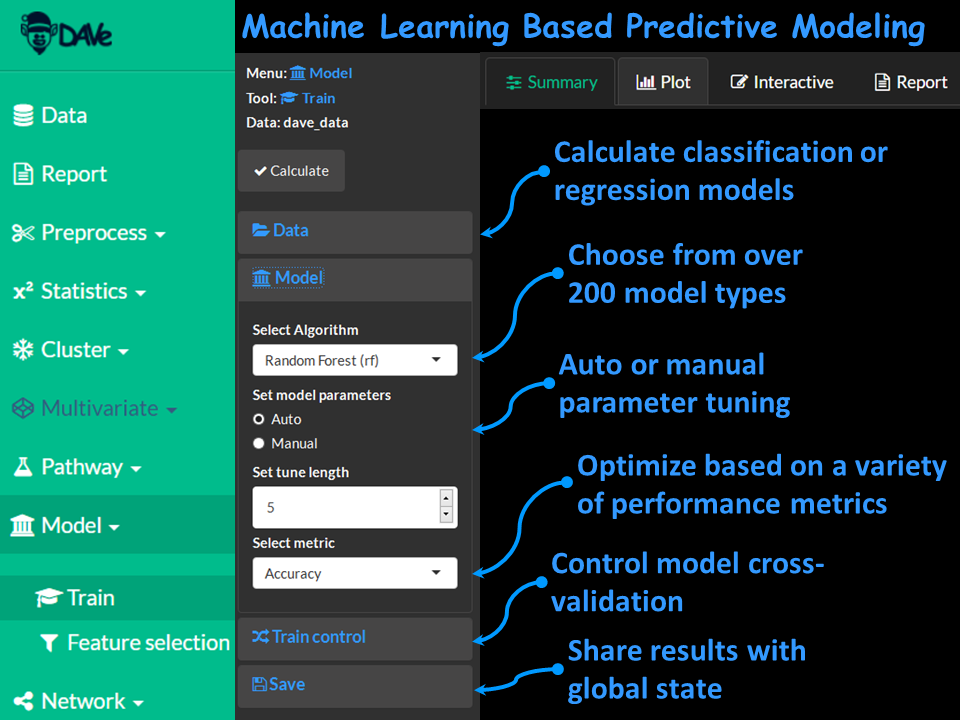
Choose from over 200 machine learning algorithms.
Easily conduct regression and classification based predictive modeling using robust model validation and feature selection methods.
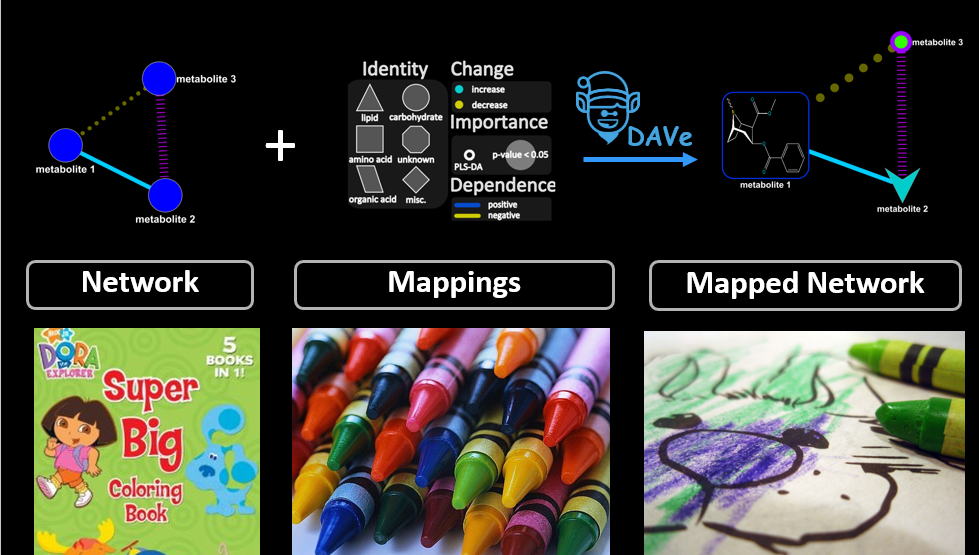
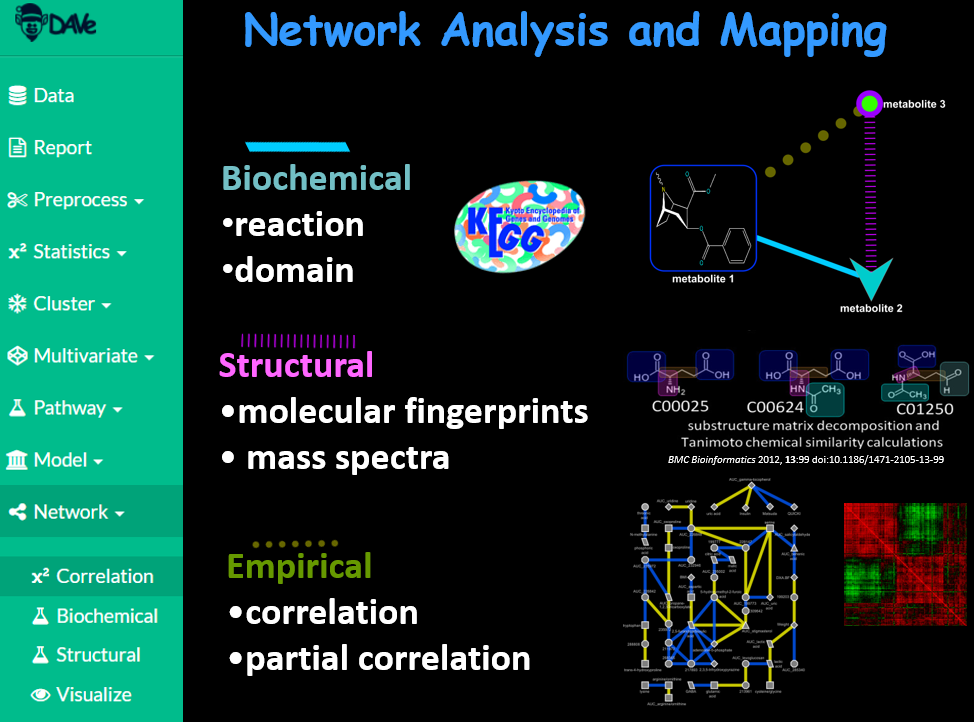
Generate complex biochemical and empirical networks.
Use biochemical domain knowledge, structural similarity and regularized correlations to calculate information rich mapped networks.
Put it all together with dynamic interactive reports.
Combine and overview all analyses results using interactive reporting features.

CDS tools are designed from the ground up with metabolomics in mind. Find out how you can connect your data with context.